Perusduunari muiden joukossa –
1. A union must know its members
The Industrial Union’s Member Survey 2023 was responded to by a huge number of people. As many as 21,976 union members who are available for work on the labour market responded to the survey. The response rate increased to 21.5%. The data was collected by means of an online questionnaire in Finnish, Swedish and English. In January-February, all members who were available for work on the labour market were invited to take the survey.
As a young metalworker puts it, responding to the survey is important to ensure that the union knows its members. The survey measures the individual experiences, attitudes and views of members about work and society as a whole.
Members found the survey meaningful
When the survey’s authors follow good scientific practice, they take respondents and their views seriously. Members also had a positive attitude towards the survey and completed the form with care. The survey clearly inspired members to share their experiences and insights.
Feedback received in the survey varies, and respondents have shared both worries and criticism. Some suspect that the responses to the survey are ignored or thrown out. This has not been the case. The detailed answers show that the survey was mostly viewed positively.
– Answering the survey was refreshing. It made me think about my own views and question certain attitudes, says a young metal industry worker.
In the feedback section, many said that they answered the questions truthfully and honestly. With the right attitude, research produces reliable data.
Good scientific practice
The questionnaire material of the member survey has been processed, coded and analysed in accordance with good scientific practice and with respect for the privacy of individuals. All detailed identifying information about respondents has been removed from the data before the statistical analysis. This ensures that the responses cannot be connected to an individual member or their place of work.
The survey’s results are categorised by age and gender as well as by region. Respondents have been divided into four age group: under 36, 36–45, 46–55, and over 55.
In addition to age and gender, an important background information is the industry worked in. Other background variables include education level, place of residence, family and life situation, labour market situation and size of the workplace.
Statistical data from standardised questions
To enable the comparability of results, the questions were mainly the same as in the member survey in 2020. Between 2020 and 2023, the world experienced three years of pandemic and the war in Ukraine, all of which have had an impact on the lives of Industrial Union members. The comparison makes it possible to detect changes as well as areas that have remained the same.
A statistical study seeks to find out what is typical or common. At the same time, the generalisability of the results is evaluated.
Union members are a varied bunch
The 2023 member survey gives a highly representative sample of Industrial Union members. Women responded to the survey at a slightly higher rate than men, and older members were more active than younger generations.
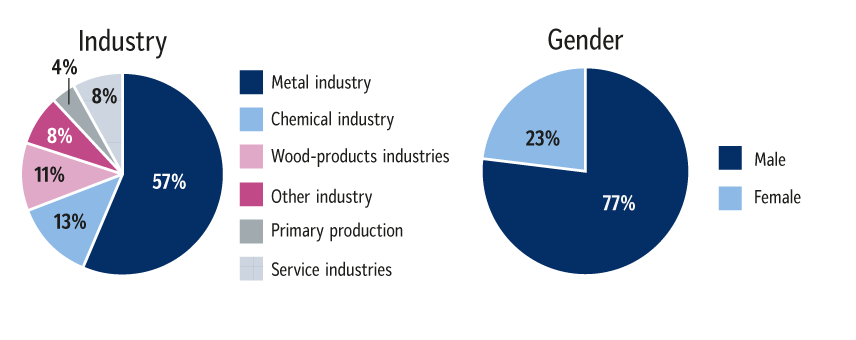
More than half of the survey’s respondents represented the metal industry. Just over one in ten workers in the chemicals and wood product industries participated in the survey. The response rate of members in other industries and services was slightly lower. The lowest response rate was among workers in primary production.
The highest response rates were among members of larger local branches. Men accounted for 77% of respondents. However, women responded more actively at a higher response rate in proportion to the percentage of union members who are women.
The average age of respondents was about 46 years. The most typical respondent is a middle-aged man employed in the metal industry. In this respect, the result is the same as three years ago. The majority of respondents were employed, and the most common education level was a vocational upper secondary qualification or a further vocational qualification.